Currently Empty: CFA0.00


Blog
How to Build a powerful SaaS Business That Makes $10K/Month in 2026 (Step-by-Step Guide)
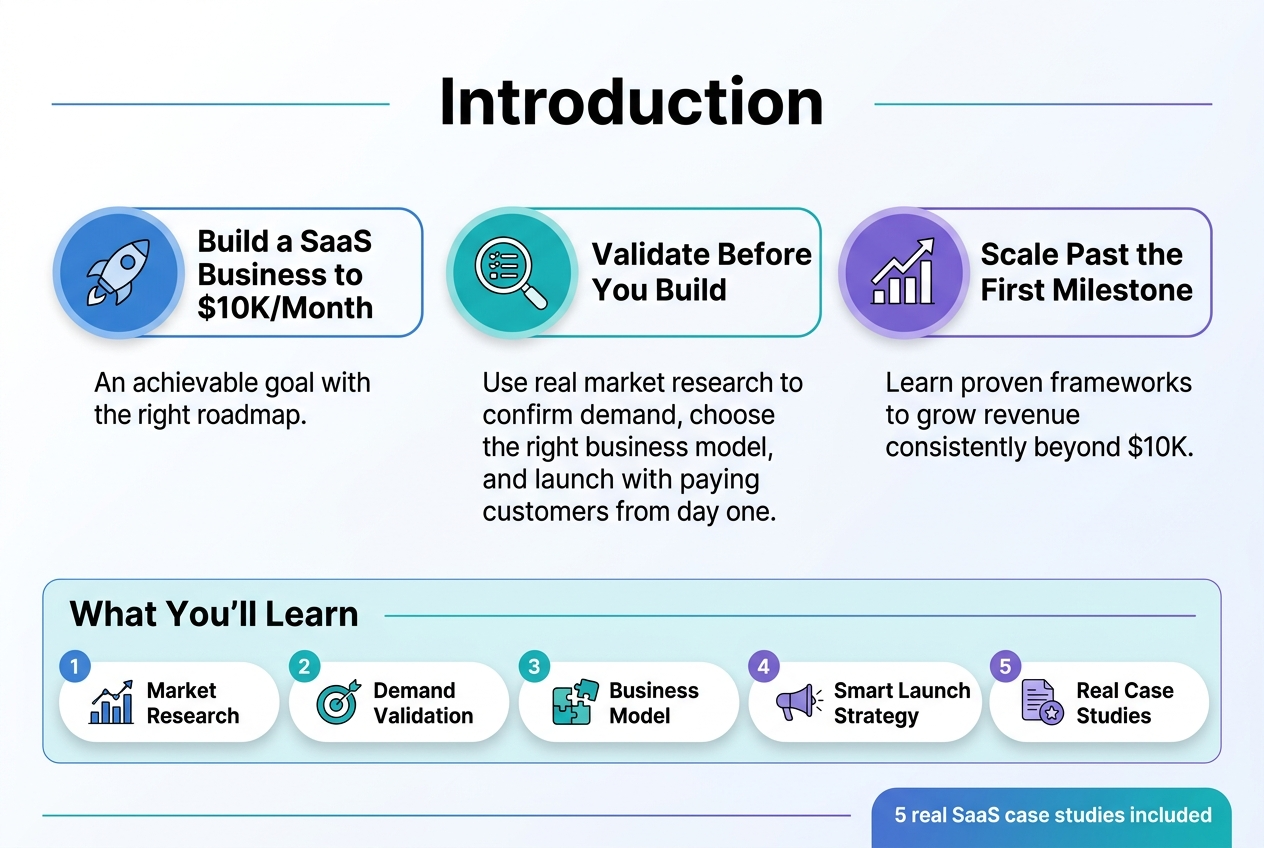
Building a SaaS business that generates $10K monthly revenue isn’t just a pipe dream—it’s an achievable goal with the right roadmap. This guide is for aspiring entrepreneurs, developers, and business owners who want to create a profitable software-as-a-service company from scratch.
Getting to $10K/month requires more than just coding skills or a great idea. You need to validate demand before you build, choose the right business model, and execute a smart launch strategy that attracts paying customers from day one.
We’ll walk through how to validate your SaaS idea using real market research techniques that save you from building something nobody wants. You’ll also learn proven strategies to scale your revenue consistently, including the exact frameworks successful founders use to grow past their first $10K milestone. Plus, we’ll examine 5 real case studies of SaaS companies that reached this revenue target, complete with the specific tactics they used.
Validate Your SaaS Idea for Market Demand
Research profitable SaaS niches with proven revenue potential
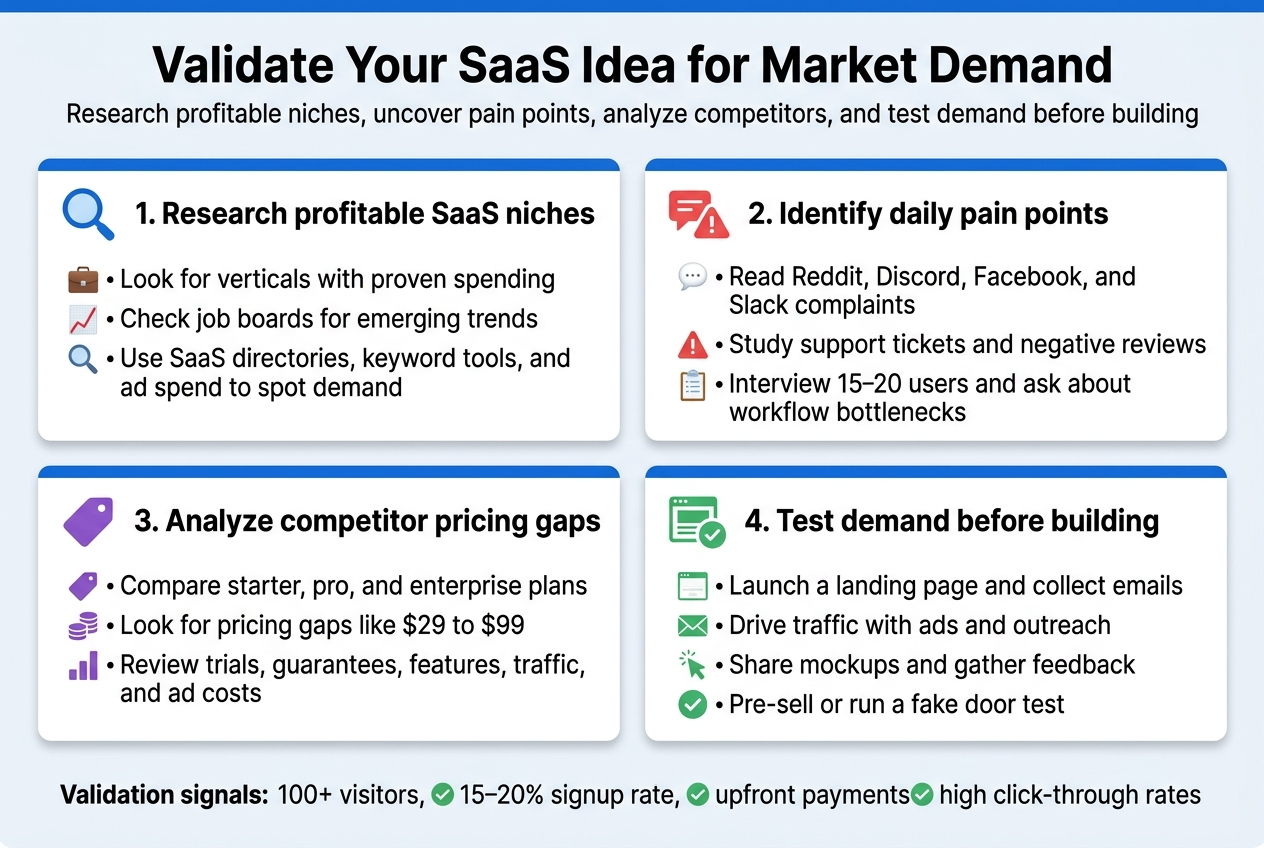
The most successful SaaS businesses target niches where customers already spend money and have urgent problems to solve. Start by exploring verticals like e-commerce tools, marketing automation, project management, and business operations software – these consistently generate strong revenue streams.
Look at job boards like AngelList, remote work platforms, and LinkedIn to spot emerging business trends. When you see companies hiring for specific roles or tools repeatedly, that signals a growing market. For example, the rise of remote work created massive demand for virtual collaboration tools and employee monitoring software.
Check out SaaS directories like SaaSHub, G2, and Capterra to analyze which categories have the most listings and user reviews. Pay attention to tools with 1,000+ reviews but average ratings below 4 stars – these represent opportunities for improvement.
Use tools like SEMrush or Ahrefs to research keyword volumes around “[industry] software” or “[problem] solution.” High search volumes indicate strong market interest. Also examine the ad spend competitors invest in Google Ads – significant advertising budgets suggest profitable markets.
Identify specific pain points your target audience faces daily
Skip generic problems and dig deep into real workflow frustrations. Join industry-specific communities on Reddit, Discord, Facebook groups, and Slack channels where your target customers complain about their daily challenges.
Set up Google Alerts for phrases like “why is [industry tool] so difficult” or “[target audience] problems.” Read through customer support tickets and negative reviews of existing solutions to understand where current tools fall short.
Conduct informal interviews with 15-20 potential users. Ask about their worst workday experiences, the manual tasks eating up their time, and the tools they wish existed. Focus on problems that occur multiple times per week and cost them money or time.
Create a simple survey using Typeform or Google Forms, sharing it in relevant communities. Ask specific questions about:
- Daily workflow bottlenecks
- Current tools they pay for but dislike
- Manual processes they wish were automated
- Budget allocated for solving these problems
Analyze competitor pricing models and market gaps
Study your top 10-15 competitors across different pricing dimensions. Create a spreadsheet tracking their starter plans, mid-tier options, and enterprise packages. Note what features live behind each paywall and identify pricing patterns in your niche.
Most SaaS companies follow predictable pricing tiers: $10-30 for basic plans, $50-100 for professional, and $200+ for enterprise. Look for gaps where competitors jump from $29 to $99 – you might find sweet spots around $49-69 that serve mid-market customers.
Examine their free trial lengths, money-back guarantees, and annual discount structures. If most competitors offer 14-day trials, consider a 30-day trial to stand out. Pay attention to which features they gate behind higher tiers – sometimes you can offer premium features at lower price points.
Check their “About” pages and funding announcements to understand their business stage. Early-stage startups often underprice to gain market share, while established players might overprice, creating opportunities for competitive positioning.
Use tools like SimilarWeb or SEMrush to estimate competitor traffic and customer acquisition costs. High traffic with expensive advertising often indicates healthy unit economics and market validation.
Test your concept with potential customers before building
Build a simple landing page describing your solution and collect email signups from interested prospects. Use tools like Carrd, Webflow, or even a basic WordPress site. Include clear value propositions and a brief demo video or mockup.
Drive traffic to your landing page through targeted Facebook/LinkedIn ads, relevant community posts, and direct outreach. Aim for at least 100 visitors to get meaningful conversion data. A 15-20% email signup rate suggests strong market interest.
Create detailed mockups or wireframes using Figma, Sketch, or even PowerPoint. Share these with potential customers during 30-minute video calls. Watch their reactions, take notes on their questions, and iterate based on feedback.
Consider pre-selling your SaaS before building it. Offer early bird pricing for founding customers willing to pay upfront. Services like Gumroad or Stripe make it easy to collect payments. If 10-20 people pay for something that doesn’t exist yet, you’ve validated real demand.
Run a “fake door” test by creating ads for your non-existent product and measuring click-through rates. High engagement indicates market interest, while low clicks suggest you need to refine your positioning or target different audiences.
Plan Your SaaS Business Model and Revenue Strategy
Choose the optimal pricing strategy for recurring revenue
The most successful SaaS businesses use value-based pricing rather than cost-plus or competitor-based approaches. Value-based pricing means setting prices based on the financial benefit your software delivers to customers.
Freemium vs. Free Trial vs. Paid-Only Models:
| Strategy | Best For | Pros | Cons |
|---|---|---|---|
| Freemium | Viral/network effects products | High adoption, word-of-mouth | Low conversion rates (2-5%) |
| Free Trial | B2B/complex products | Higher intent users | Requires strong onboarding |
| Paid-Only | Niche/premium solutions | Immediate revenue validation | Higher barrier to entry |
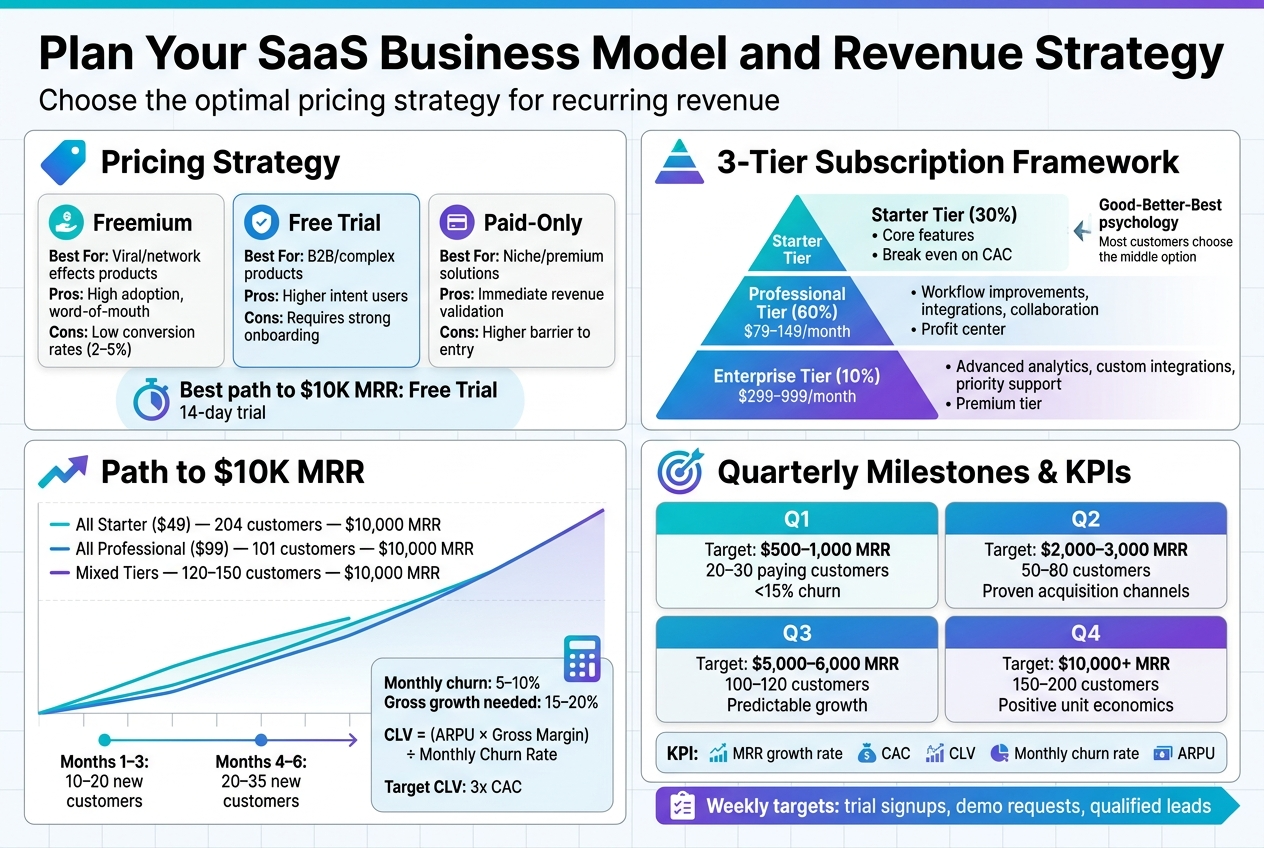
For reaching $10K MRR, free trials typically work best because they attract serious buyers while filtering out tire-kickers. A 14-day trial gives users enough time to see value without making your product feel cheap.
Psychological pricing principles that drive conversions:
- End prices in 9 ($29, $99, $299) for cost-conscious segments
- Use round numbers ($50, $100, $500) for premium positioning
- Create clear price anchors with your highest tier listed first
Design subscription tiers that maximize customer lifetime value
Smart tier design follows the “Good-Better-Best” psychology where most customers choose the middle option. Your pricing structure should guide users toward your target tier while accommodating different customer segments.
The 3-Tier Framework:
Starter Tier (30% of customers): Include core features that solve the primary problem. Price this to cover customer acquisition costs and break even. Typical range: $29-49/month.
Professional Tier (60% of customers): Your profit center. Add workflow improvements, integrations, and collaboration features. Price 2-3x your starter tier: $79-149/month.
Enterprise Tier (10% of customers): Premium features like advanced analytics, custom integrations, priority support. Price 5-10x starter tier: $299-999/month.
Feature differentiation strategies:
- Usage limits (users, projects, storage)
- Advanced functionality (automation, reporting, API access)
- Support levels (email, chat, phone, dedicated manager)
- Customization options (branding, custom fields, workflows)
Avoid feature stuffing in lower tiers. Each upgrade should feel like a natural progression as customers grow.
Calculate your path to $10K monthly recurring revenue
Working backwards from $10K MRR helps you set realistic customer acquisition goals and timeline expectations.
Revenue Mix Scenarios:
| Tier | Price | Customers Needed | Total MRR |
|---|---|---|---|
| All Starter ($49) | $49 | 204 customers | $10,000 |
| All Professional ($99) | $99 | 101 customers | $10,000 |
| Mixed Tiers | Varies | 120-150 customers | $10,000 |
Realistic monthly growth rates:
- Months 1-3: 10-20 new customers
- Months 4-6: 20-35 new customers
- Months 7-12: 35-50 new customers
Account for churn rates between 5-10% monthly for early-stage SaaS. This means you need 15-20% gross growth to achieve 10% net growth.
Customer Lifetime Value (CLV) calculation:
CLV = (Average Revenue Per User × Gross Margin) ÷ Monthly Churn Rate
Target a CLV that’s at least 3x your customer acquisition cost (CAC) to ensure profitability.
Set realistic growth milestones and revenue targets
Breaking your $10K goal into quarterly milestones prevents overwhelm and enables course correction.
Quarter 1 Goals (Months 1-3):
- Target: $500-1,000 MRR
- Focus: Product-market fit validation
- Metrics: 20-30 paying customers, <15% churn
Quarter 2 Goals (Months 4-6):
- Target: $2,000-3,000 MRR
- Focus: Streamline onboarding and reduce churn
- Metrics: 50-80 customers, proven acquisition channels
Quarter 3 Goals (Months 7-9):
- Target: $5,000-6,000 MRR
- Focus: Scale proven marketing channels
- Metrics: 100-120 customers, predictable growth
Quarter 4 Goals (Months 10-12):
- Target: $10,000+ MRR
- Focus: Optimize for profitability
- Metrics: 150-200 customers, positive unit economics
Key performance indicators to track:
- Monthly Recurring Revenue (MRR) growth rate
- Customer Acquisition Cost (CAC)
- Customer Lifetime Value (CLV)
- Monthly churn rate
- Average Revenue Per User (ARPU)
Set weekly revenue targets and track leading indicators like trial signups, demo requests, and qualified leads. These metrics predict future revenue and help you adjust tactics quickly when you’re off track.
Build Your Minimum Viable Product Fast and Cost-Effectively
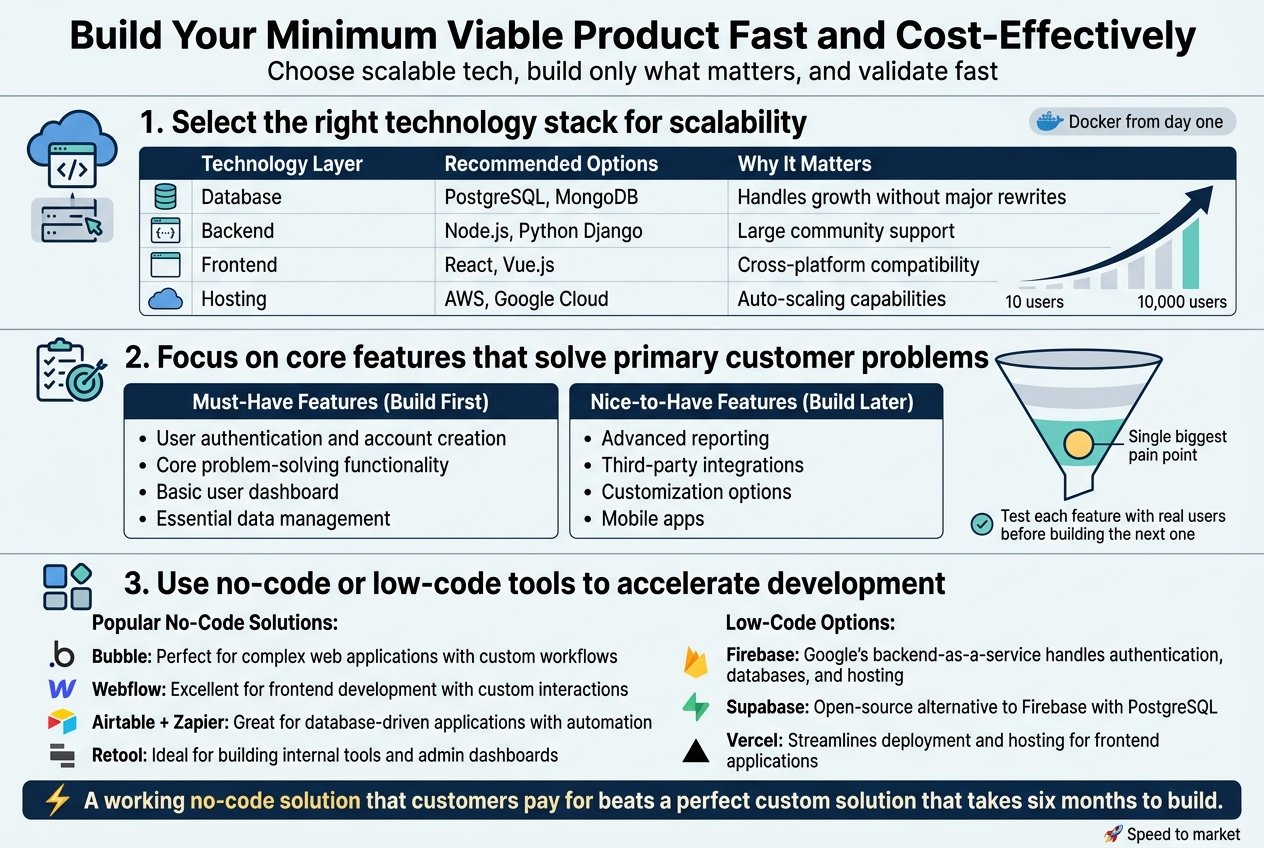
Select the right technology stack for scalability
Your technology choices today will either accelerate or sabotage your growth tomorrow. The stack you pick needs to handle 10 users just as smoothly as it handles 10,000.
Start with proven, battle-tested technologies. PostgreSQL remains the gold standard for SaaS databases because it scales beautifully and handles complex queries without breaking a sweat. For your backend, consider Node.js with Express or Python with Django – both have massive communities and extensive libraries that’ll save you months of development time.
For the frontend, React or Vue.js give you the flexibility to build responsive interfaces that work across all devices. Don’t get caught up in the latest framework hype. Stick with technologies that have strong documentation and active support communities.
Cloud hosting is non-negotiable. AWS, Google Cloud, or DigitalOcean provide auto-scaling capabilities that grow with your user base. Set up your infrastructure with containers using Docker from day one – this makes deployment and scaling infinitely easier later.
| Technology Layer | Recommended Options | Why It Matters |
|---|---|---|
| Database | PostgreSQL, MongoDB | Handles growth without major rewrites |
| Backend | Node.js, Python Django | Large community support |
| Frontend | React, Vue.js | Cross-platform compatibility |
| Hosting | AWS, Google Cloud | Auto-scaling capabilities |
Focus on core features that solve primary customer problems
Your MVP should do one thing exceptionally well rather than ten things poorly. Look at your customer interviews and identify the single biggest pain point your target audience faces daily.
Build only the features that directly address this core problem. Everything else is noise that slows down your launch and confuses early users. If you’re building project management software, focus on task creation and assignment first – skip the time tracking, reporting, and integration features for now.
Create a feature priority matrix:
Must-Have Features (Build First)
- User authentication and account creation
- Core problem-solving functionality
- Basic user dashboard
- Essential data management
Nice-to-Have Features (Build Later)
- Advanced reporting
- Third-party integrations
- Customization options
- Mobile apps
Remember, your first customers will forgive missing features if your core offering delivers real value. They won’t forgive a bloated product that doesn’t solve their main problem effectively.
Test each feature with real users before building the next one. This prevents you from wasting weeks on features nobody actually wants or uses.
Use no-code or low-code tools to accelerate development
No-code and low-code platforms can cut your development time from months to weeks, especially for early prototypes and MVPs. These tools have evolved far beyond simple website builders into powerful application development platforms.
Popular No-Code Solutions:
- Bubble: Perfect for complex web applications with custom workflows
- Webflow: Excellent for frontend development with custom interactions
- Airtable + Zapier: Great for database-driven applications with automation
- Retool: Ideal for building internal tools and admin dashboards
Low-Code Options:
- Firebase: Google’s backend-as-a-service handles authentication, databases, and hosting
- Supabase: Open-source alternative to Firebase with PostgreSQL
- Vercel: Streamlines deployment and hosting for frontend applications
Don’t let developer ego stop you from using these tools. Many successful SaaS companies started with no-code solutions and only moved to custom code when they hit platform limitations.
Start by building your MVP with no-code tools to validate demand quickly. Once you’re generating revenue and understand your users better, you can gradually replace components with custom code where needed.
The key is speed to market. A working no-code solution that customers pay for beats a perfect custom solution that takes six months to build.
Launch Your SaaS and Acquire Your First Paying Customers
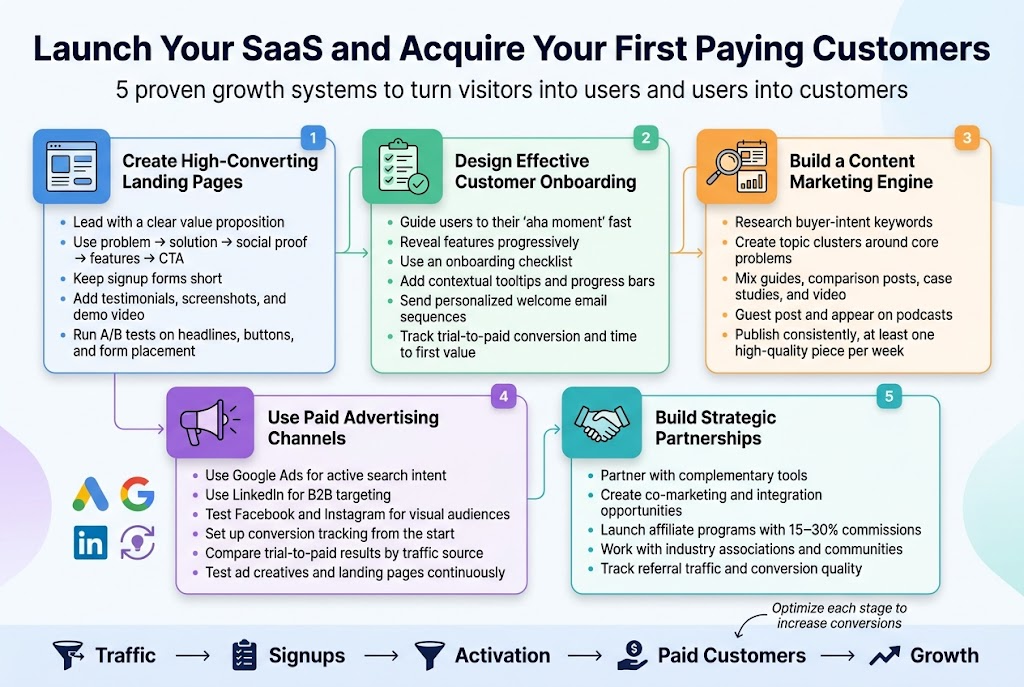
Create compelling landing pages that convert visitors
Your landing page is your digital storefront, and it needs to work overtime to turn curious visitors into paying customers. A high-converting SaaS landing page tells a story that resonates with your target audience’s pain points while showcasing your solution as the obvious choice.
Start with a headline that immediately communicates your value proposition. Skip the clever wordplay and get straight to the benefit. Instead of “Revolutionize Your Workflow,” try “Cut Project Management Time by 50% in 7 Days.” The second version tells visitors exactly what they’ll gain and when they’ll see results.
Your page structure should follow a proven formula: problem acknowledgment, solution presentation, social proof, features breakdown, and clear call-to-action. Use customer testimonials strategically throughout the page, not just lumped together at the bottom. A well-placed quote next to a feature description can dramatically boost credibility.
The hero section needs three elements: compelling headline, supporting subtext, and an above-the-fold signup form or trial button. Keep forms short – email address might be enough for a free trial. Every additional field reduces conversion rates by approximately 11%.
Include a demo video or product screenshots that show real functionality. Visitors want to see your product in action before committing. Make sure these visuals highlight the core benefits, not just pretty interfaces.
Test different versions continuously. A/B testing your headlines, button colors, form placement, and social proof can increase conversions by 20-50%. Tools like Hotjar or Google Optimize make this process straightforward without requiring technical expertise.
Implement effective customer onboarding processes
Customer onboarding determines whether users become long-term subscribers or churn within the first month. The goal is getting users to their “aha moment” as quickly as possible – that specific point where they realize your product’s value.
Design a progressive onboarding flow that introduces features gradually. Don’t overwhelm new users with every capability on day one. Start with the core functionality that delivers immediate value, then layer on advanced features over time.
Create an onboarding checklist that guides users through essential setup steps. Each completed task should move them closer to experiencing your product’s main benefit. For a project management tool, this might include creating their first project, inviting team members, and setting up their first task.
Use in-app tooltips and guided tours sparingly. Too many pop-ups frustrate users and create cognitive overload. Instead, provide contextual help exactly when and where users need it. Consider implementing a progress bar showing onboarding completion percentage to encourage follow-through.
Send personalized welcome email sequences that complement the in-app experience. Space these emails 2-3 days apart, focusing on specific use cases and success stories. Include links to relevant help documentation and video tutorials.
Track onboarding metrics religiously. Monitor where users drop off in the process and iterate accordingly. Key metrics include trial-to-paid conversion rate, time to first value, and feature adoption rates during the trial period.
Develop a content marketing strategy for organic growth
Content marketing builds trust, demonstrates expertise, and drives qualified organic traffic that converts better than paid channels. Your content strategy should position you as the go-to resource for solving problems your SaaS addresses.
Start by researching keywords your target customers actually search for. Tools like Ahrefs, SEMrush, or even Google’s Keyword Planner reveal search volumes and competition levels. Focus on long-tail keywords that indicate buying intent rather than just informational searches.
Create content clusters around core topics relevant to your audience. If you’re building accounting software for freelancers, develop comprehensive guides around tax preparation, invoice management, and business expense tracking. Each cluster should include a pillar page with supporting blog posts that link back to it.
Diversify your content formats based on your audience preferences. Some topics work better as step-by-step tutorials, others as comparison articles or case studies. Video content often performs well for software demonstrations, while detailed guides might be more effective as blog posts.
Guest posting on industry publications and podcasts amplifies your reach beyond your own audience. Research publications your target customers read and pitch relevant, valuable content ideas. Always include a natural mention of how your SaaS solves related problems.
Maintain a consistent publishing schedule. Search engines favor websites that regularly publish fresh, valuable content. Start with one high-quality piece per week rather than trying to publish daily and burning out.
Use paid advertising channels for faster customer acquisition
Paid advertising accelerates customer acquisition when organic channels take too long to gain traction. The key is choosing platforms where your target audience spends time and crafting messages that resonate with their specific needs.
Google Ads works exceptionally well for SaaS because you’re capturing people actively searching for solutions. Target both competitor keywords and problem-focused search terms. Someone searching “alternatives to [competitor]” is further along the buying journey than someone searching “how to manage projects.”
Start with exact match keywords to control costs and gradually expand to phrase and broad match as you gather data. Use negative keywords liberally to avoid wasting budget on irrelevant clicks. Create separate ad groups for different user intents (informational vs. transactional).
LinkedIn advertising excels for B2B SaaS targeting decision-makers by job title, company size, and industry. The cost per click is higher than Google, but the targeting precision often delivers better qualified leads. Use LinkedIn’s matched audiences feature to retarget website visitors with specific messaging.
Facebook and Instagram can work for consumer-focused SaaS or B2B tools with visual appeal. The platform’s detailed demographic and interest targeting helps reach specific user segments effectively.
Set up proper conversion tracking from the start. Track not just clicks and signups, but trial-to-paid conversion rates by traffic source. This data reveals which channels deliver customers with the highest lifetime value, guiding future budget allocation.
Test different ad creatives and landing page combinations continuously. What works for one audience segment might fail completely with another. Keep testing until you find combinations that consistently deliver customers at an acceptable cost.
Build strategic partnerships for referral traffic
Strategic partnerships create mutual value while driving qualified traffic to your SaaS. The best partnerships feel natural to both audiences and provide genuine value rather than forced cross-promotion.
Identify complementary tools your target customers already use. If you’re building email marketing software, partner with CRM providers, landing page builders, or e-commerce platforms. Look for integration opportunities that enhance both products’ functionality.
Develop formal partnership programs with clear benefits for both parties. This might include revenue sharing, co-marketing opportunities, or technical integrations that benefit both user bases. Document partnership terms clearly to avoid misunderstandings later.
Content partnerships often provide immediate value with lower commitment. Co-create webinars, whitepapers, or blog posts that showcase how your tools work together. These assets serve both marketing teams while providing valuable resources for shared audiences.
Affiliate programs can drive significant growth when structured properly. Offer competitive commissions (typically 15-30% for SaaS) and provide affiliates with marketing materials, training, and ongoing support. Track performance carefully and focus resources on top-performing partners.
Industry associations and communities offer partnership opportunities often overlooked by competitors. Sponsor relevant events, contribute to association publications, or offer exclusive discounts to members. These relationships build credibility while reaching highly targeted audiences.
Track partnership performance using unique referral codes or links. Measure not just traffic volume but conversion quality. Some partners might drive high traffic with low conversion rates, while others deliver fewer visitors who convert at much higher rates.
Scale Your SaaS to Consistent $10K Monthly Revenue
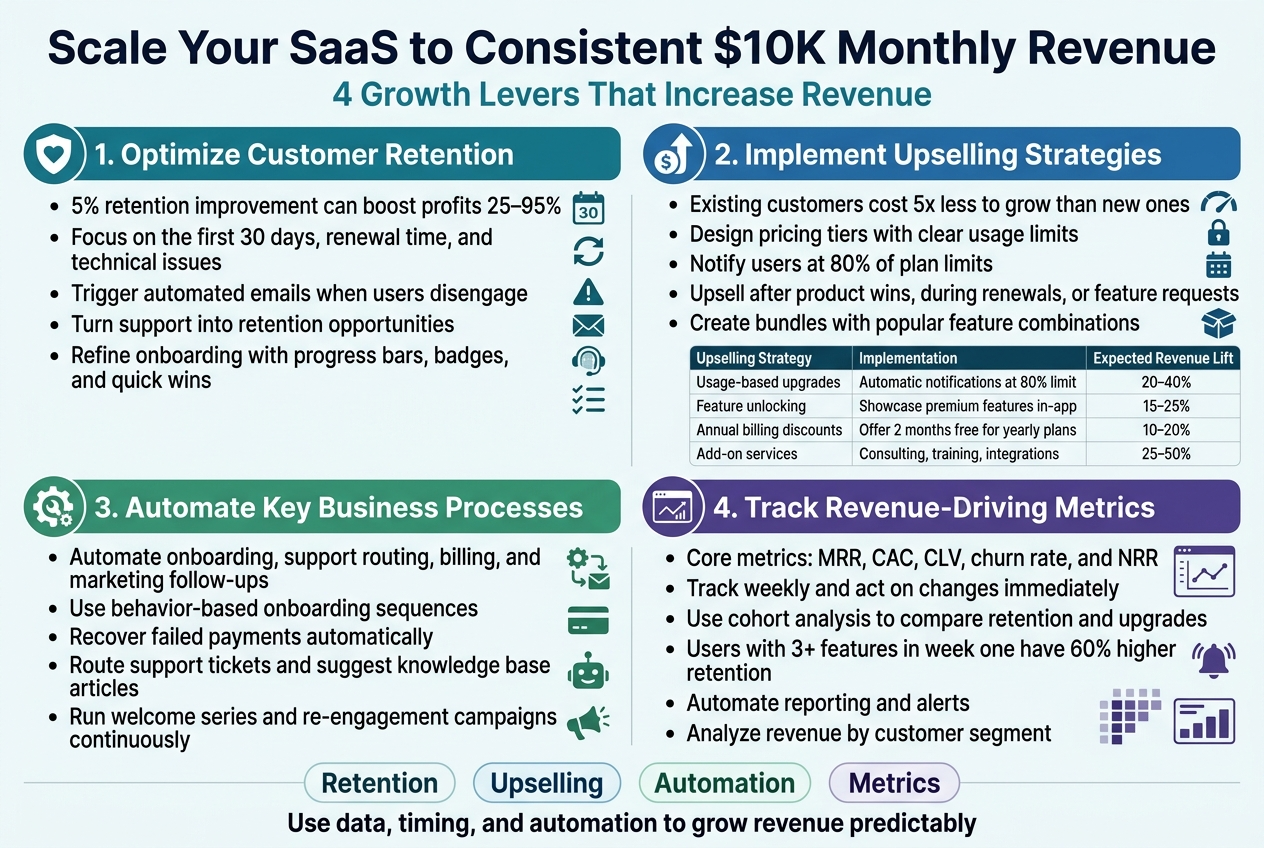
Optimize customer retention to reduce churn rates
Customer retention becomes your biggest revenue multiplier once you hit your initial growth targets. A 5% improvement in retention can boost profits by 25-95%, making it your most cost-effective growth lever.
Start by identifying your churn triggers through exit interviews and usage data analysis. Most SaaS customers leave during three critical windows: the first 30 days, at renewal time, or when they experience technical issues. Create automated email sequences that kick in when users show signs of disengagement – like not logging in for a week or skipping key features.
Build a proactive support system that reaches out before problems escalate. When customers contact support, turn those interactions into retention opportunities by offering personalized tips or additional training. Many successful SaaS companies assign dedicated success managers to accounts above a certain value threshold.
Your onboarding process needs constant refinement. Track where new users drop off and create targeted interventions. Add progress bars, achievement badges, and quick wins that demonstrate immediate value. The faster users experience their “aha moment,” the more likely they’ll stick around long-term.
Implement upselling strategies to increase average revenue per user
Growing revenue from existing customers costs five times less than acquiring new ones. Smart upselling focuses on genuine value delivery rather than pushy sales tactics.
Design your pricing tiers to naturally encourage upgrades. Create clear usage limits on lower plans that successful customers will eventually hit. When they approach these limits, automatically notify them about upgrade options with personalized recommendations based on their specific usage patterns.
| Upselling Strategy | Implementation | Expected Revenue Lift |
|---|---|---|
| Usage-based upgrades | Automatic notifications at 80% limit | 20-40% |
| Feature unlocking | Showcase premium features in-app | 15-25% |
| Annual billing discounts | Offer 2 months free for yearly plans | 10-20% |
| Add-on services | Consulting, training, integrations | 25-50% |
Time your upsell offers strategically. The best moments are right after customers achieve significant wins with your product, during renewal conversations, or when they request features only available in higher tiers. Use in-app messaging to highlight premium features contextually when users might need them most.
Create bundle packages that combine popular features at compelling price points. Many customers prefer simplified decision-making over complex à la carte options. Your data will reveal which features cluster together in customer usage patterns.
Automate key business processes for efficiency
Automation transforms your SaaS from a time-intensive operation into a scalable revenue machine. Start with repetitive tasks that consume the most manual hours: customer onboarding, support ticket routing, billing management, and marketing follow-ups.
Set up automated customer onboarding sequences that guide new users through setup, feature discovery, and initial value realization without human intervention. Use tools like Intercom or Mixpanel to trigger personalized messages based on user behavior. When someone signs up but doesn’t complete their profile, send a helpful reminder with setup tips.
Billing automation prevents revenue leaks and reduces administrative overhead. Failed payment recovery sequences should automatically retry charges, send dunning emails, and offer alternative payment methods before canceling accounts. Many SaaS businesses lose 5-10% of revenue to failed payments that could be recovered with proper automation.
Your support system benefits enormously from smart automation. Create chatbots that handle common questions and route complex issues to appropriate team members. Set up automatic ticket escalation when response times exceed thresholds. Knowledge base articles should be dynamically suggested based on user questions.
Marketing automation nurtures leads and re-engages inactive customers without constant manual effort. Welcome series, educational email courses, and behavioral trigger campaigns run continuously in the background while you focus on strategic growth initiatives.
Track and analyze metrics that drive revenue growth
Data-driven decisions separate successful SaaS businesses from those that plateau. Focus on metrics that directly correlate with revenue growth rather than vanity metrics that feel good but don’t drive results.
Your core metrics dashboard should include Monthly Recurring Revenue (MRR), Customer Acquisition Cost (CAC), Customer Lifetime Value (CLV), churn rate, and Net Revenue Retention (NRR). Track these weekly and investigate any significant changes immediately.
Cohort analysis reveals how customer behavior changes over time. Compare retention rates, upgrade patterns, and usage levels across different customer segments. Customers acquired through different channels often behave differently – this insight helps optimize your marketing spend allocation.
Product usage metrics predict future churn and expansion opportunities. Identify which features correlate with long-term retention and ensure new customers discover them quickly. Users who engage with three or more features in their first week typically have 60% higher retention rates.
Set up automated reporting that delivers key metrics to stakeholders without manual work. Weekly dashboards keep everyone aligned on progress toward revenue goals. When metrics trend in concerning directions, automated alerts ensure quick responses before small problems become major revenue threats.
Revenue per customer segment analysis helps prioritize product development and marketing efforts. Enterprise customers might generate 10x more revenue but require different features than small business users. Your roadmap should reflect the revenue potential of different segments while maintaining product coherence.
5 proven real case studies with urls
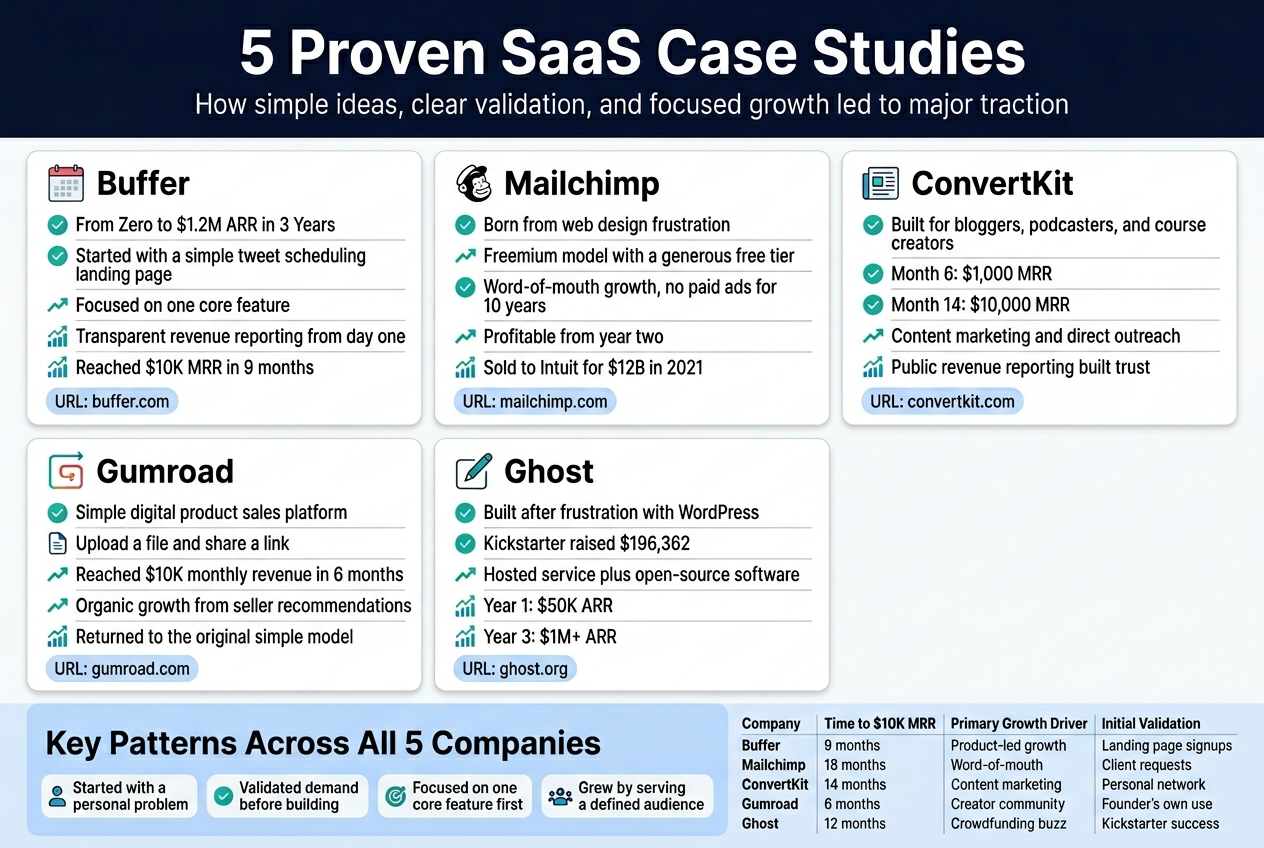
Buffer: From Zero to $1.2M ARR in Three Years
Buffer started as a simple social media scheduling tool when Joel Gascoigne couldn’t find an easy way to schedule his tweets. Instead of building a complex platform immediately, he created a basic landing page describing his idea and measured interest through email signups.
Key Success Factors:
- Started with manual processes behind a simple interface
- Focused on one core feature: tweet scheduling
- Used customer feedback to guide every product decision
- Implemented transparent revenue reporting from day one
Buffer reached $10K monthly recurring revenue within 9 months by charging $10-50 per month for their scheduling service. They prioritized customer support and built features based on actual user requests rather than assumptions.
Lessons: Start incredibly simple, validate with real money, and scale based on proven demand patterns.
URL: https://buffer.com
Mailchimp: Email Marketing Giant Born from Web Design Frustration
Ben Chestnut and Dan Kurzius were running a web design agency when clients constantly asked for email marketing solutions. They built Mailchimp as a side project in 2001, bootstrapping it while maintaining their design business for years.
Growth Strategy:
- Freemium model with generous free tier (2,000 subscribers)
- Word-of-mouth marketing through excellent user experience
- Zero paid advertising for the first decade
- Focus on small businesses ignored by enterprise solutions
The company stayed profitable from year two and reached $10K monthly revenue within 18 months. Their quirky brand personality and monkey mascot helped them stand out in a crowded market.
Current Status: Sold to Intuit for $12 billion in 2021, proving that bootstrap SaaS companies can achieve massive exits.
URL: https://mailchimp.com
ConvertKit: Email Marketing Built for Creators
Nathan Barry left his successful design career to build ConvertKit after recognizing that existing email tools didn’t serve content creators well. He launched with $5,000 in savings and focused exclusively on bloggers, podcasters, and course creators.
Revenue Milestones:
- Month 1: $0
- Month 6: $1,000 MRR
- Month 11: $5,000 MRR
- Month 14: $10,000 MRR
- Month 24: $100,000 MRR
Winning Tactics:
- Content marketing through Nathan’s personal blog
- Direct outreach to potential customers
- Built features specifically for creator workflows
- Transparent revenue reporting and growth stories
Barry shared his entire journey publicly, including revenue numbers and strategic decisions, which built trust and attracted customers who wanted to support his mission.
URL: https://convertkit.com
Gumroad: Simple Digital Product Sales Platform
Sahil Lavingia built Gumroad in 2011 as a weekend project to sell his own design work. The platform allows creators to sell digital products with minimal setup – just upload a file and share a link.
Growth Approach:
- Launched with basic file hosting and payment processing
- Added features based on seller feedback
- Focused on ease of use over advanced functionality
- Built community around creator success stories
Gumroad hit $10K monthly revenue within 6 months by taking a small percentage of each sale. The platform grew organically as satisfied sellers recommended it to other creators.
Pivot Point: After raising venture capital and trying to scale rapidly, Lavingia returned to the original simple model, laid off most staff, and refocused on sustainable growth.
URL: https://gumroad.com
Ghost: Publishing Platform for Professional Writers
John O’Nolan created Ghost after becoming frustrated with WordPress’s complexity for simple blogging. He launched a Kickstarter campaign in 2013 that raised $196,362, proving strong market demand for a streamlined publishing platform.
Business Model Evolution:
- Open-source software with hosted Ghost Pro service
- Subscription tiers from $9-199 per month
- Focus on performance, simplicity, and modern design
- Target professional writers and publications
Revenue Growth:
- Year 1: $50K ARR
- Year 2: $500K ARR
- Year 3: $1M+ ARR
Ghost succeeded by staying true to its core mission of simple, fast publishing while larger competitors added complexity. They built a loyal community of writers who valued the platform’s focus and reliability.
URL: https://ghost.org
Key Patterns Across All Case Studies
| Company | Time to $10K MRR | Primary Growth Driver | Initial Validation |
|---|---|---|---|
| Buffer | 9 months | Product-led growth | Landing page signups |
| Mailchimp | 18 months | Word-of-mouth | Client requests |
| ConvertKit | 14 months | Content marketing | Personal network |
| Gumroad | 6 months | Creator community | Founder’s own use |
| Ghost | 12 months | Crowdfunding buzz | Kickstarter success |
Each company started with a specific problem they personally experienced, validated demand before building, and focused on one core feature until it worked perfectly. They all reached $10K monthly revenue by solving real problems for defined audiences rather than trying to build everything for everyone.
Building a profitable SaaS business that hits $10K monthly revenue isn’t just a pipe dream – it’s totally doable when you follow the right steps. The key is starting with solid market validation, choosing a revenue model that fits your audience, and building an MVP that solves real problems without breaking the bank. Once you launch, focus on getting those first paying customers who will become your biggest advocates and help you understand what’s working.
The jump from launch to consistent $10K months comes down to smart scaling strategies and learning from what others have done successfully. Those case studies we covered show that different approaches can work, but they all share common elements: listening to customers, iterating quickly, and staying focused on delivering value. Start with validating your idea this week – even if it’s just sending out a simple survey or building a landing page to test interest. Your future $10K monthly business is waiting for you to take that first step.